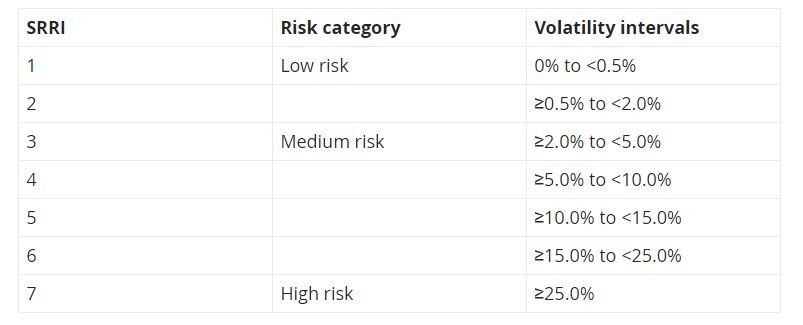
The synthetic risk and reward indicator (SRRI) is used to classify investment funds into one of three different risk categories (low risk, medium risk, high risk). It is calculated on the basis of Austrian and European regulatory requirements. This indicator forms an integral part of the Key Investor Information Document (KIID) and gives the historical volatility of the fund unit price on a scale from 1 to 7.
Investment funds with a low SRRI typically exhibit fewer price fluctuations and therefore a lower probability of temporary capital losses. Funds with a high SRRI experience greater fluctuations and also a greater risk of capital loss.
 |
The fund category is not a reliable indication of future performance and may change in the course of time.
|
|
A category 1 rating should not be construed as indicating that the investment is free of any risk.
|
|
The risk indicator (SSRI) is indicated separately for each of the funds on our website, in the fact sheet and in the KIID.
|
Methodology for the calculation of the SRRI
The volatility is calculated using the weekly past returns of the investment fund over the last five years. Where the investment fund’s returns history is too short, the performance of a representative portfolio model or other methodologies stipulated by legislators for SRRI calculation may be used. Any distribution of income should be taken into account. Volatility and SRRI as risk indicators do not differentiate the direction of fluctuations but only give the general inclination to fluctuate. A volatility of 3.0% means that the value of the relevant investment fund fluctuated on average by up to plus/minus 3.0% annually over the last five years.
