| Aggregate |
 |
|
By taking the same analysis criteria we use for individual stocks and applying them to a group of stocks, theScreener.com creates what we call "aggregates". This systematic approach makes it possible to compare aggregates in the same way one compares stocks.
|
 |
| Aggregate Value |
|
|
|
| |
| Alerts Profile ! |
|
|
This alert is triggered when the investment profile and the defined risk are no longer appropriate. Assuming that the percentage of shares, bonds or funds does not respect the defined risk and profile, then this alert will turn on.
|
| |
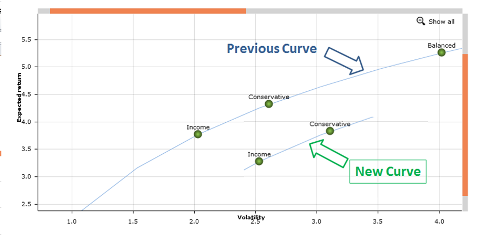
| Alerts Strategy ! |
|
|
This alert is triggered when an Investment profile does not any longer respect the initial defined criteria. A "Balanced" portfolio, considered balanced in its profile, has shifted on the curve due to a new risk / return profile "Balanced".
|
| |
| Alpha |
|
|
Alpha is a risk-adjusted measure of the "active return" on an investment. The Alpha represents an asset's performance after subtracting the market's influence beyond the asset manager's control. It is used to evaluate an asset manager's added value over a certain period of time. It can also be seen as the average observed performance of an asset, while its reference index shows no performance.
A positive Alpha indicates an asset manager is outperforming the market.
Formula: At the Y-intercept to the right of the regression line where X = monthly performance of an index and Y = monthly performance of an asset (min. 12 points).
|
| |
| Alternatives |
|
|
---- STOCKS ----
This section presents the 10 best stocks in the same Group, Sector or Country based on the criteria used by theScreener.
To qualify as alternative a stock must have a Global Evaluation of Slightly Positive or Positive.
---- FUNDS ----
This section presents the 10 best funds in the same Asset Class, Profile or Area based on the criteria used by theScreener.
To qualify as alternative a fund must have at least 3 Stars and a Global Evaluation of Slightly Positive or Positive.
|
| |
| Asset Allocation List (AAL) |
|
|
This is a list of investment-quality stocks that can be used for asset allocation.
---- Since August 28th 2019 ----
A stock will belong to the Asset Allocation List (AAL):
 |
its global evaluation is slightly positive or positive;
|
OR
|
its global evaluation is neutral and previously slightly positive or positive;
|
---- Between December 08th 2011 and August 27th 2019 ----
A stock will belong to the Asset Allocation List (AAL):
|
its Stars is greater than 1 star;
|
|
its global evaluation is neutral, slightly positive or positive;
|
|
its Sensitivity is low or moderate;
|
---- Until December 07th 2011 ----
For a stock will qualify for the Asset Allocation List (AAL) when it has three or more stars
and:
A stock will be removed from the Asset Allocation List (AAL) when it drops to one or no stars and:
|
| |
| Asset Class Ratings |
|
|
Asset Class Rating, or Stars, for each Asset Class reflect the interest in this category and are issued from the universe of Funds. The Stars are based on different criteria as Information Ratio, Sharpe, Technical Trend or Performance.
There are three different ratings:
|
Positive - the number of stars is 3 or 4, the asset class is interesting
|
|
Neutral - the number of stars is 2
|
|
Negative - the number of stars is 0 or 1, the asset class is not interesting
|
|
| |
| Assets |
|
|
This figure represents the global wealth of the portfolio; the figure in () brackets is the percentage unclassified.
|
| |
| Bad News Factor |
|
|
To determine the Bad News Factor we analyze a stock's dividend-adjusted declines in rising markets. In this purely
objective analysis, the actual reasons for a stock's behavior are not important. If a stock
price falls while its relative index goes up, it can be assumed that the stock's performance
has been affected by bad news - hence the name, "Bad News Factor".
How to interpret the Bad News Factor:
Simply take the percentage difference (in basis points) between the rise of the index and the
decline of the stock. For example, if a stock drops 2%, while during the same time period its
reference index goes up 1%, the percentage difference is 3, or 300 basis points. Therefore,
our Bad News Factor will be 300.
In bi-weekly intervals that correspond to our updates, we track a stock's movement over the
course of a standard sliding 52-week period. Each time the stock goes down while its reference
index goes up, the percentage difference is calculated, absorbed into the yearly average and
expressed in basis points as the Bad News Factor.
As stocks rarely react in the same way the number used to calculate the average may differ
from one stock to the next.
For example, the number 114 would mean that during the last 12 months, each time UBS went down
when the SMI went up, the average of the differences measured between the respective
performances was 1.14%.
Things to remember:
|
The higher the Bad News Factor, the more a stock is sensitive to bad news.
|
|
The smaller the Bad News Factor, the less the stock is sensitive to bad news, or said
differently, the less investors seem to be concerned by the impact of bad news on the stock.
|
|
| |
| Bear Mkt Factor |
|
|
To determine the Bear Mkt Factor we analyze the relationship between a stock's dividend-adjusted price movements and
declining markets, hence the name, "Bear Mkt Factor". Ultimately then, the question that concerns
us is: on average, when the market declines, how does a stock tend to react?
How to interpret the Bear Mkt Factor:
Simply take the percentage difference (in basis points) between the decline of the reference
index and the performance of the stock. For example, if a stock drops 3%, while during the
same time period its reference index goes down 1%, the percentage difference is 2, or 200
basis points. Therefore, our Bear Mkt Factor will be 200. If the decline of the stock is less than
that of the index, or if the stock goes up, our indicator will be expressed in a negative
number. A negative number indicates that the stock tends to show solid resistance to drops in
the market.
Understanding Correlation:
The closer a stock's Bear Mkt Factor is to zero (on either the positive or negative side), the more
it will be inclined to mirror its relative index's behavior when the index goes down.
In bi-weekly intervals that correspond to our updates, we track an index's movement over the
course of a standard sliding 52-week period. Each time the index goes down we calculate the
percentage difference between it and each one of its individual stocks. This difference is
then absorbed into the yearly average and expressed in basis points as the Bear Mkt Factor.
Things to remember:
|
The higher the Bear Mkt Factor, the more a stock is likely to drop when its relative index drops.
|
|
A Bear Mkt Factor that is strongly negative means the stock is more likely to resist losses in a
declining market.
|
|
| |
| Benchmark |
|
|
The benchmark provided by the Professional is the industry group relative to a particular
stock in the portfolio in its local country.
The Professional creates its own tickers for these benchmarks by combining the
three-letter abbreviation of each industry group with the two-letter abbreviation of its
corresponding country. These two abbreviations are coupled by adding symbol @.
Therefore, IND@CH would be the Industrial industry group in Switzerland (see also
Group, Market).
How to change the benchmark
If you prefer to use a different benchmark than the one assigned by the Professional you
can do so by following these simple steps:
|
click on the edit tab
|
|
select the stock whose benchmark you would like to change
|
|
under the column title action click edit
|
|
at the left of your screen in the Benchmark section (5), select the new industry group and
country you would like
|
|
in the section below (6), click on Submit.
|
|
return to your portfolio by clicking on the portfolio tab.
|
|
| |
| Beta 1 year in basis pts |
|
|
Beta measures the sensitivity of a stock relative to market movements. By definition, the
market has a Beta of 1.0. To be consistent with our other indicators, the number we use to
express Beta is 100, which is equivalent to the number 1.0. Stocks with a Beta greater than
100 tend to amplify the overall movements of the market. Stocks with a Beta between 0 and 100
tend to move in the same direction as the market, but not as far. The market can be considered
as the portfolio of all stocks, so the "average stock" has a Beta of 100.

|
| |
| Bollinger bands |
|
|
Bollinger Bands represent the average expected fluctuations over 20 days set to 2 standard deviations. A breakout of the band is very often a sign of a trend reversal in the short term.
Should the two bands contract, it indicates a strong drop in volatility, signaling that the market is about to trend (positively or negatively). One of the oscillators (theScreener's Trend Oscillator, MACD, or RSI) will confirm the possible direction of the new trend.
|
| |
| Buy Date |
|
|
Used in the Portfolio View of the Portfolio section, this term refers to the
date a stock was purchased.
|
| |
| Buy Price |
|
|
Used in the Portfolio View of the Portfolio section, this term refers to the
price at which a stock was purchased.
|
| |
| Correlation |
|
|
Correlation is a measure of the extent to which two random variables track one another.
The correlation of two random variables can range from -1 to 1.
Our system measures the correlation of a stock relative to its national index.
When a stock is positively correlated to its national index, it tends to appreciate or
depreciate at the same time as its index. When a stock is negatively correlated to its
national index, it tends to fall when its national index rises, and vice versa.
Example: on October 16, 2002, UBS has a correlation of 0.92.
This means that UBS is highly correlated to the SMI and tends to follow 85% of its up and down movements.
|
| |
| Current Ratio |
|
|
The current ratio is a liquidity ratio that measures whether a firm has enough resources to meet its short-term obligations. It is the ratio of a firm's current assets to its current liabilities. Generally, a current ratio < 1 is seen as problematic. While a high current ratio is regarded as a positive sign for the company's financial situation, unusually high current ratios could also indicate that the company doesn't use its current assets efficiently.
|
| |
| Dividend |
|
|
|
| |
| Earnings Revision Trend |
|
|
|
| |
| EBIT (adjusted) |
|
|
Adjusted EBIT margin is the ratio of Earnings Before Interest, Taxes, and Unusual Expenses to revenue. It indicates a company's operating profitability from its core business by excluding financing effects, taxes, and one-off items, making underlying performance more comparable across periods and companies.
|
| |
| Equity on Assets |
|
|
The ratio Equity on Assets shows the share of own funds in relation to the total assets. The higher the value, the more conservative the company's finances.
|
| |
| ESG Funds (Morningstar) |
|
|
ESG data are provided by 
Sustainable Investment
Morningstar defines a strategy as a "Sustainable Investment" if the use of one or more approaches to sustainable investing is central to the strategy's overall investment process, based on its prospectus or other regulatory filings.
Sustainable Investments are categorized into two subgroups. "General ESG Investments" focus on the broad incorporation of environmental, social, and corporate governance factors, generally through the use of company ESG metrics and exclusions, where the use of these approaches plays a central role in their overall investment process. "Sustainability Themed Investments," by contrast, focus on one or more sustainability themes. The specific themes pursued by these strategies are further identified using Sustainalytics Impact Themes. They include Climate Action, Healthy Ecosystems, Basic Needs, Resource Security, and Human Development. More on these themes can be found below in the individual attribute definition section.
ESG Engagement
These are investment products that use shareholder engagement, including raising resolutions, active proxy voting, and direct company engagement, to pursue ESG goals with invested companies.
General ESG Investment
General ESG Investment strategies use ESG criteria as a central focus or binding factor in their security-selection and portfolio-construction process.
Strategies that incorporate ESG factors typically have explicit sustainability criteria that invested companies must meet. These strategies may use ESG criteria to help them limit risk, identify investment opportunities, and engage with companies. They may also apply certain exclusions. These strategies endeavor to promote sustainability and minimize negative impact, without focusing on a specific theme or area of action.
Sustainability Themed Investment
Sustainability Themed Investment strategies explicitly target exposure to one or more sustainability themes as part of their investment process.
Some may target specific themes like climate action or diversity and inclusion; others may pursue a broader sustainability-themed approach that covers more than one theme. Beyond their thematic focus, these strategies may or may not employ the approaches used by General ESG Investments in their investment decisions. Although most sustainability-themed funds are equity investments, some are fixed-income funds that invest in bonds that finance sustainable projects.
To provide investors with more detail on a strategy's thematic focus, investments are categorized using the Sustainalytics Impact Themes. A sustainability-themed investment may belong in one or more of these thematic groups. An investment tagged to one of the five thematic groups may not be involved in all of the theme's underlying subthemes.
|
Climate Action
Climate Action covers thematic investments related to climate change. This theme includes strategies focused on investing in companies or projects that contribute broadly to the transition to a low-carbon economy. It also includes green energy and clean tech strategies that invest in companies or projects that facilitate the transition to renewable energy. Examples include strategies focused on wind, solar, hydro, tidal, and geothermal power and those focused on green infrastructure and energy storage. Subthemes to be found under this broad theme include, but are not limited to, carbon transition, decarbonization, greenhouse gas emissions, climate change adaptation and mitigation, and climate solutions.
|
|
Healthy Ecosystems
This theme is concerned with safeguarding ecologically sound environments on land, air, and water. It includes strategies that invest in companies operating in industries that positively impact the environment, such as companies that reduce pollution or perform remediation activities. It does not include water or greenhouse gas emissions/climate-change-related subthemes, as these are covered under other themes. Examples of subthemes found in this category include biodiversity, deforestation, life under water, natural ecosystems, planetary boundaries, planetary health, and sustainable agriculture.
|
|
Basic Needs
This theme concerns the basic needs of humans with a particular focus on individuals in need. Basic needs include access to food, housing, essential healthcare concerning major and neglected diseases, clean water, and energy for underserved populations. It also addresses human safety, including safe workplaces and communities. Examples of strategies to be found in this category include those that target themes such as affordable drinking water, affordable electricity, clean water and sanitation, food security, safe working conditions, and human rights.
|
|
Resource Security
This theme is concerned with efficient use of resources and circular economies. Resources include water, timber, metals, minerals, gases, and all types of manufactured materials. Investments that target sectors related to any of these biological resources or that focus on subthemes such as sustainable water and wastewater, eco-efficient and/or circular economy adapted products, waste management, and recycling, are included under this theme. Additional examples of strategies in this group include investments that promote action in areas such as responsible production and consumption, land use, food waste, water consumption, water depletion, or forest conversion.
|
|
Human Development
This theme is concerned with enhancing human capabilities and promoting social progress. The theme includes measures that support education, equality, employment opportunities, and reduced inequalities. Strategies focusing on social themes such as diversity, equity and inclusion, education, or micro-finance may be found under this theme. Other examples in this category include financial inclusion, equal opportunities, decent work and economic growth, and sustainable cities and communities.
|
Employs Exclusions
"Employs Exclusions" strategies exclude certain sectors, companies, or practices. This indicator is marked if any exclusions are employed by the strategy, even if it is not a "Sustainable Investment" strategy based on the criteria outlined above.
|
Uses Norms-Based Screening
These are strategies that cite international agreements, such as the United Nations Global Compact or Universal Declaration of Human Rights, as a guideline for investing responsibly. These frequently involve human rights violations, child labor issues, or investments in companies in conflict zones.
|
|
Excludes Abortion/Stem Cells
These are strategies that avoid investments in companies that derive revenue from abortion services, abortifacients, and/or the use of embryonic stem cells. Strategies that exclude human cloning are also included in this data point because of the use of embryonic stem cells and the issue's relationship to life ethics questions. While many strategies employing these exclusions also exclude contraceptives, the exclusion of the latter is reflected in "Excludes Other."
|
|
Excludes Adult Entertainment
These are strategies that intend to avoid investments in companies that derive a significant percentage of their revenue from adult entertainment. Strategies that identify specific exclusions of a subindustry, such as pornography, also receive this tag.
|
|
Excludes Alcohol
These are strategies that intend to avoid investments in companies that derive a significant percentage of their revenue from the production, distribution, or sale of alcohol.
|
|
Excludes Animal Testing
These are strategies that intend to avoid investments in companies that engage in animal-testing practices.
|
|
Excludes Controversial Weapons
These are strategies that avoid investments in companies that derive a significant percentage of their revenue from controversial military weapons, such as weapons of mass destruction, nuclear weapons, land mines, and cluster munitions. These do not necessarily preclude investments in companies with revenue from conventional military weapons but may include companies that produce materials used in controversial weapons.
|
|
Excludes Fossil Fuel
These are strategies that avoid investments in companies that derive a significant percentage of their revenue from the extraction, distribution, sale, or use of any fossil fuel. These strategies intend to avoid investments in companies that derive a significant percentage of their revenue from coal, petroleum, natural gas, oil shales, bitumen, tar sands, and heavy oils.
|
|
Excludes Fur and Specialty Leather
These are strategies that intend to avoid investments in companies that derive a significant percentage of their revenue from the production, distribution, or sale of fur and/or specialty leather.
|
|
Excludes Gambling
These are strategies that intend to avoid investments in companies that derive a significant percentage of their revenue from gambling or casinos.
|
|
Excludes GMOs
These are strategies that intend to avoid investments in companies that are significantly involved in the use of genetically modified organisms.
|
|
Excludes Military Contracting
These are strategies that intend to avoid investments in military contractors or companies that derive a significant percentage of their revenue from nonconsumer military contracting or operations. Some strategies cite companies that derive a significant amount of revenue from working with military organizations or defense more generally. This category does not necessarily exclude nonmilitary companies that are involved in materials or components used in controversial weapons.
|
|
Excludes Nuclear
These are strategies that intend to avoid investments in companies that are significantly involved in the research or production of nuclear energy. This does not reflect exclusions of nuclear weapons, which are instead reflected in "Excludes Controversial Weapons."
|
|
Excludes Palm Oil
These are strategies that intend to avoid investments in companies that derive a significant percentage of their revenue from the production, distribution, or sale of unsustainable palm oil and its products. This may not require the exclusion of companies that produce, distribute, or sell palm oil that has been shown to be sustainably sourced, including cosmetics and lotions.
|
|
Excludes Pesticides
These are strategies that intend to avoid investments in companies that derive a significant percentage of their revenue from the production, distribution, or sale of pesticides for environmental or biological concerns.
|
|
Excludes Small Arms
These are strategies that intend to avoid investments in companies that derive a significant percentage of their revenue from the production, distribution, or sale of personal weapons and small arms. These strategies most frequently exclude firearms but may exclude other personal weapons as well.
|
|
Excludes Thermal Coal
These are strategies that intend to avoid investments in companies that derive a significant percentage of their revenue from the extraction, distribution, sale, or use of thermal coal. Investments in companies exposed to metallurgical coal are typically not included in this category.
|
|
Excludes Tobacco
These are strategies that intend to avoid investments in companies that derive a significant percentage of their revenue from the production, distribution, or sale of tobacco and/or tobacco-related products.
|
|
Excludes Other
These are strategies that intend to avoid investments in companies that are significantly involved in other products or practices deemed to be contradictory to the strategy's values. Examples include companies with business operations in countries whose governments pose human rights concerns or more general language about companies whose products or services have a negative impact on customers.
|
EU Sustainable Finance Disclosure Regulation (SFDR)
The EU Sustainable Finance Disclosure Regulation (SFDR) is a set of EU rules which aim to make the sustainability profile of funds clearer, and easier for investors to understand and compare. It's an indication whether, according to the EU SFDR, the financial product promotes Environmental or Social Characteristics (Article 8), has Sustainable Investment Objectives (Article 9) or if it does not fit into either category (Not Stated).
SFDR focuses on pre-defined metrics for assessing the environmental, social and governance (ESG) outcomes of the investment process at a fund level and is designed to prevent greenwashing and ensure a systematic, transparent and harmonized approach within financial markets. It is part of the EU's wider Sustainable Finance Framework which is backed by a broad set of new and enhanced regulations that apply across the EU. The SFDR goes hand in hand with the Sustainable Finance Action Plan which aims to promote sustainable investment across the EU, and a new EU Taxonomy to create a level playing field across the whole EU.
Not Stated
Not stated is applied to those share classes that do not fit into either category (Article 8 or Article 9) as provided by the pre-contractual disclosure document or the periodic disclosure document whichever has the latest effective date. This includes article 6.
Article 6
Article 6 covers funds which do not integrate any kind of sustainability into the investment process and could include stocks currently screened and excluded from investment mandates by ESG funds, such as coal fired power generation, mining, or tobacco companies. While these will be allowed to continue to be sold in the EU, providing a clear labelling system which defines them as non-sustainable may make these funds harder to market when compared against more sustainable funds.
Article 8 - Environmental or Social Characteristics
Article 8 applies where a financial product promotes, among other characteristics, environmental or social characteristics, or a combination of those characteristics, provided that the companies in which the investments are made follow good governance practices. Investments may include energy companies with a mix of generation assets, and companies able to show clear progress towards better ESG practices.
Article 9 - Sustainable Investment Objectives
Article 9 covers products targeting sustainable investments and applies where a financial product has sustainable investment as its objective and an index has been designated as a reference benchmark. Investments should have clear ESG benefits as a primary goal, rather than the benefits being incidental to the primary business activity.
|
| |
| ESG Funds (MSCI) |
|
|
ESG data are provided by 
ESG Rating
The Fund ESG Rating is designed to assess the resilience of a fund's aggregate holdings to long-term, financially relevant, ESG risks. The Fund ESG Rating is assessed on a seven-point letter rating scale from CCC to AAA, with CCC and AAA being the lowest and highest possible fund scores, respectively. The ratings are derived from the asset-weighted average of MSCI ESG Ratings of a fund's underlying holdings.
For more information, see MSCI's documentation
UN Global Compact (UNGC) Compliance Violation
These are investment products that use shareholder engagement, including raising resolutions, active proxy voting, and direct company engagement, to pursue ESG goals with invested companies.
General ESG Investment
The percentage of portfolio's market value exposed to companies in violation of the UN Global Compact principles. See MSCI's Stocks ESG Help or MSCI's documentation for more information on the company-level assessment. criteria to help them limit risk, identify investment opportunities, and engage with companies. They may also apply certain exclusions. These strategies endeavor to promote sustainability and minimize negative impact, without focusing on a specific theme or area of action.
Business Involvement
The Business Involvement shows the percentage of portfolio's market value exposed to companies flagged for one or more controversial business involvements. The threshold used to flag a company depends on the restrictiveness level applied:
|
Most restrictive: Companies with any tie to the controversial domain
|
|
Highly restrictive: Companies with revenues generated in the controversial domain
|
|
Moderately restrictive: Companies deriving 5% or more revenue from the production, or at least 15% aggregate revenue from production, distribution, retail, and supply in the controversial domain
|
|
Least restrictive: Companies deriving at least 10% of their revenue from the production or ownership of products or assets in the controversial domain
|
EU Sustainable Finance Disclosure Regulation (SFDR)
The EU Sustainable Finance Disclosure Regulation (SFDR) is a set of EU rules which aim to make the sustainability profile of funds clearer, and easier for investors to understand and compare. It's an indication whether, according to the EU SFDR, the financial product promotes Environmental or Social Characteristics (Article 8), has Sustainable Investment Objectives (Article 9) or if it does not have a sustainability scope (Article 6).
SFDR focuses on pre-defined metrics for assessing the environmental, social and governance (ESG) outcomes of the investment process at a fund level and is designed to prevent greenwashing and ensure a systematic, transparent and harmonized approach within financial markets. It is part of the EU's wider Sustainable Finance Framework which is backed by a broad set of new and enhanced regulations that apply across the EU. The SFDR goes hand in hand with the Sustainable Finance Action Plan which aims to promote sustainable investment across the EU, and a new EU Taxonomy to create a level playing field across the whole EU.
Article 6 - Funds without a sustainability scope
Article 6 covers funds which do not integrate any kind of sustainability into the investment process and could include stocks currently screened and excluded from investment mandates by ESG funds, such as coal fired power generation, mining, or tobacco companies. While these will be allowed to continue to be sold in the EU, providing a clear labelling system which defines them as non-sustainable may make these funds harder to market when compared against more sustainable funds.
Article 8 - Environmental or Social Characteristics
Article 8 applies where a financial product promotes, among other characteristics, environmental or social characteristics, or a combination of those characteristics, provided that the companies in which the investments are made follow good governance practices. Investments may include energy companies with a mix of generation assets, and companies able to show clear progress towards better ESG practices.
Article 9 - Sustainable Investment Objectives
Article 9 covers products targeting sustainable investments and applies where a financial product has sustainable investment as its objective and an index has been designated as a reference benchmark. Investments should have clear ESG benefits as a primary goal, rather than the benefits being incidental to the primary business activity.
|
| |
| ESG Stocks (Inrate) |
|
|
ESG data are provided by 
ESG Rating
Overall Company Rating based on Environmental Grade, Social Grade, Labour Grade and Governance Grade (weighted differently depending on sector) from D- (lowest) to A+ (highest).
Environment Rating
Environment Rating based on Environment Poduct Impact and ECSR Rating (weighted differently depending on sector) from D- (lowest) to A+ (highest).
Environment CSR
Environmental Rating based on the CSR Assessment, grade from D- (lowest) to A+ (highest). The CSR Assessment analyzes whether or not companies are working systematically and effectively to improve their sustainability impacts. It encompasses the environmental, social, and governance aspects of sustainability. Examples for ECSR relevant topics: resource usage, contamination, waste generation, etc.
Environment Product Impact
Environmental Grade based on the Impact Assessment, grade from D- (lowest) to A+ (highest). The Impact Assessment evaluates the sustainability impacts of companies' products and services on the environment and society
|
where these impacts are actually felt, i.e. throughout the product life cycle - the "cradle to grave" approach;
|
|
with respect to whether or not these goods and services satisfy basic social needs with a better sustainability-related impact than other companies.
Inrate's Impact Assessment of products and services is based on a detailed assessment of a company's revenue.
|
Society Rating
Social Grade based on Society Social Impact Grade and SCSR Grade (weighted differently depending on sector) from D- (lowest) to A+ (highest).
Society CSR
Social Grade based on the CSR Assessment, grade from D- (lowest) to A+ (highest). The CSR Assessment analyzes whether or not companies are working systematically and effectively to improve their sustainability impacts. It encompasses the environmental, social, and governance aspects of sustainability. Examples for SCSR relevant topics: consumers, employees, suppliers or contractors, and other stakeholders.
Society Labor
The Labour Grade is part of the CSR assessment and - among other themes - encompasses topics such as employees and suppliers or contractors.
Society Social Impact
Social Grade based on the Impact Assessment, grade from D- (lowest) to A+ (highest). The Impact Assessment evaluates the sustainability impacts of companies' products and services on the environment and society
|
where these impacts are actually felt, i.e. throughout the product life cycle - the "cradle to grave" approach;
|
|
with respect to whether or not these goods and services satisfy basic social needs with a better sustainability-related impact than other companies.
Inrate's Impact Assessment of products and services is based on a detailed assessment of a company's revenue.
|
Governance Rating
Governance Grade is part of the CSR assessment and encompasses the strategic management of CSR-related issues.
% Total critical products
The percentage of revenue generated by critical products.
% Adult Entertainment
The percentage of revenue generated by adult entertainment.
% Alcohol
The percentage of revenue generated by alcohol.
% Defense
The percentage of revenue generated by defense equipment and products.
% Fuel Fossils
The percentage of revenue generated by fuel fossils.
% Gambling
The percentage of revenue generated by gambling related products.
% Genetic Engineering
The percentage of revenue generated by genetic engineering activities.
% Nuclear Energy
The percentage of revenue generated by nuclear energy.
% Palm oil
The percentage of revenue generated by palm oil.
% Pesticides
The percentage of revenue generated by pesticides.
% Tobacco
The percentage of revenue generated by tobacco products.
% Coal
The percentage of revenue generated by coal.
Last Update
The last update of the review.
More information on ESG Impact Ratings  , Methodology , Methodology
|
| |
| ESG Stocks (MSCI) |
|
|
ESG data are provided by
ESG Rating
The most prominent feature is the company's ESG rating, expressed as a letter grade. This rating summarizes how well a company manages material ESG risks and opportunities relative to its industry peers. Ratings are assigned on a seven-point scale from CCC (the lowest) to AAA (the highest):
|
AAA: The company is a leader in managing ESG risks. It has robust systems in place to address relevant environmental, social, and governance challenges.
|
|
AA to A: The company demonstrates above-average performance in managing ESG factors compared to its peers.
|
|
BBB to BB: Indicates the company has an average level of performance in managing ESG risks and opportunities.
|
|
B to CCC: The company is considered a laggard, with significant challenges or a lack of management on key ESG issues.
|
These ratings provide a quick snapshot of how well a company is positioned to mitigate long-term sustainability risks.
For more information, see MSCI's documentation
Significant Controversies by Indicator
The most prominent feature is the company's ESG rating, expressed as a letter grade. This rating summarizes how well a company manages material ESG risks and opportunities relative to its industry peers. Ratings are assigned on a seven-point scale from CCC (the lowest) to AAA (the highest):
Environment Rating
MSCI ESG Controversies provides timely and consistent evaluations of ESG-related controversies. It measures a company's involvement in negative activities reported by media, NGOs, and other stakeholders. Analysts at MSCI review allegations of controversial events or practices and assign scores based on the severity of the impact, the company's role, and the status of the resolution between the company and stakeholders.
MSCI ESG Controversies Flags are leveraged to identify corporate entities implicated in third-party allegations concerning practices or incidents that may contradict recommendations under the following global norms and conventions:
|
The Organisation for Economic Co-operation and Development (OECD) Guidelines for Multinational Enterprises;
|
|
The Ten Principles of the United Nations Global Compact (UNGC);
|
|
The International Labour Organization's (ILO) fundamental conventions and ILO Declaration on Fundamental Principles and Rights at Work; and
|
|
The United Nations Guiding Principles on Business and Human Rights (UNGP).
|
MSCI ESG Controversies is not designed to verify or confirm any allegations or claims of violations. Instead, it provides a consistent assessment of controversies in the form of scores and color-coded flags.
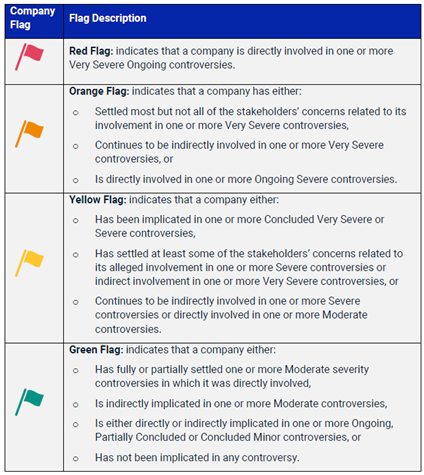
|
Red: Indicates that a company is involved in one or more very severe controversies.
|
|
Orange: Indicates that a company has been involved in one or more recent severe structural controversies that are ongoing
|
|
Yellow: Indicates that the company is involved in severe-to-moderate level controversies.
|
|
Green: Indicates that the company is not involved in any major controversies. However, this could indicate that the company is involved in minor or moderate controversies.
|
For more information, see MSCI's documentation
Sustainable Development Goals (SDG)
The MSCI SDG Net Alignment Score is a holistic assessment of each company's overall net contribution towards each of the 17 individual SDGs. This score takes product alignment and operational alignment into account with equal weights.
While we display the SDG Net Alignment Scores on a continuous scale [-10, 10], MSCI also categorizes these scores into five assessments. The conversion is done as follows:
|
Score >5.0: Strongly Aligned.
|
|
Score between 2.0 and 5.0, inclusive: Aligned.
|
|
Score less than 2.0 but higher than -2.0: Neutral.
|
|
Score equal to or less than -2.0 but higher than -10: Misaligned.
|
|
Score equal to -10: Strongly Misaligned.
.
|
Note: MSCI does not provide an aggregate company-level assessment.
For more information, see MSCI's documentation
Sustainable Development Goals (SDG)
The MSCI SDG Net Alignment Score is a holistic assessment of each company's overall net contribution towards each of the 17 individual SDGs. This score takes product alignment and operational alignment into account with equal weights.
|
Pass: The company has not been implicated in any controversy cases within the scope of the UNGCs, or its involvement in such cases is not considered to be severe enough to warrant a Fail or Watch List designation.
|
|
Watch List: There are three possible reasons for this assessment: 1) An alleged direct involvement in an ongoing severe controversy, or 2) the company settled most concerns related to a very severe controversy, or 3) the company continues to be involved in a very severe controversy indirectly.
|
|
Fail: An alleged direct involvement in at least one very severe ongoing controversy in an area covered by the UNGCs.
|
The individual UNGCs can be grouped into Labor, Human Rights, Environment, and Anti-Corruption. Each of which is assessed individually on a 4-level scale: green , yellow , orange , red (from best to worst).
For more information, see MSCI's documentation
Business (Revenue) Involvement Screening
MSCI's Business Involvement Screening provides data on the extent of companies' involvement in products, services, processes or operations that may cause, contribute to, or be associated with adverse social or environmental impacts or may conflict with certain investors' values.
MSCI's Business Revenue Involvement Screenings provide reported or estimated revenue attributed to business activities.
Note: Involvement evaluations are not dependent on companies generating revenues from the screened business activities. It is possible that the outcome of an Involvement evaluation indicates involvement, whereas the Revenue Involvement evaluation output is zero.
For more information, see MSCI's documentation
|
| |
| Global Evaluation |
|
|
---- STOCKS ----
The Global Evaluation is designed to give a fast and easy yet broadly supported evaluation of a stock. It combines the impression of fundamental and technical elements (valuation, earnings revisions, technical factors, group benchmarking) with the sensitivity rating (Bear Market & Bad News Factor). A better rating in the individual areas leads in the sum to a better Global Evaluation (scoring model).
More information
---- FUNDS ----
The Global Evaluation is designed to give a fast and easy yet broadly supported evaluation of a fund or ETF. It combines the impression of fundamental and technical elements (Information Ratio, Sharpe, technical factors) with the sensitivity rating (Bear Market & Bad News Factor). A better rating in the individual areas leads in the sum to a better Global Evaluation (scoring model).
More information
The best possible rating is five green bars  , the weakest rating is one red bar , the weakest rating is one red bar  . .
---- INDICES, INDUSTRIES & BENCHMARKS ----
The ratings from theScreener combine the upside rating (stars) based on fundamental and technical criteria with a sensitivity rating based on the behaviour of equities over the last 12 months.
Positions can show 3 Evaluations according to the following matrix:
Since 23/07/2025:
Before 23/07/2025:
 |
| |
| Group |
|
|
The averaged 6,000 stocks in theScreener.com's database are divided into 18 internationally recognized
standard industry groups.
| AUT |
Automobiles |
IND |
Industrial Goods & Services |
| BAN |
Banks |
INS |
Insurance |
| BAS |
Basic Materials |
MED |
Media |
| CHE |
Chemicals |
PHG |
Personal & Household Goods |
| CON |
Construction |
RET |
Retail |
| ENE |
Oil & Gas |
TEC |
Technology |
| FSV |
Financial Services |
TEL |
Telecom |
| FOB |
Food & Beverage |
TRL |
Travel & Leisure |
| HEA |
Health Care |
UTI |
Utilities |
|
| |
| Information Ratio |
|
|
The information ratio shows the relationship between the Alpha and the Tracking-error. It measures an asset's tendency to outperform (positive ratio) or underperform (negative ratio) its reference index within an equivalent risk structure
A high ratio shows that risk is being well rewarded.
Formula: Alpha / Tracking-error
|
| |
| Long Term Growth |
|
|
This is the estimated annual growth rate of future earnings, normally projected
over the next two to three years, and expressed as a percentage.
Our Long Term Growth measure is averaged over at least three different estimates
obtained from banks, brokers, or analysts. A figure of 18 means that for the next
two to three years, the growth in company earnings is evaluated at an average of 18%
per year.
Caution: Be skeptical of high long-term growth projections that differ
greatly from growth rates of associated national market indexes or industry groups.
These can often result from very low earnings for the most recent few years, thereby
making a firm's projected earnings growth appear very strong by comparison with the
lean years. To verify this information the aggregate analysis and world indexes
functions can be very helpful.
|
| |
| Long Term P/E |
|
|
It is the PE ratio calculated on the basis of estimates of long-term earnings.
|
| |
| MACD |
|
|
The MACD (Moving Average Convergence Divergence) calculates the difference between the 12 and the 26 day moving averages. Buy and sell signals are triggered by movements in the MACD signal line, which is based on a 9 day moving average.
If the MACD and 9 day moving average lines cross below the zero level it indicates a buy. If they cross above the zero level beware of a decline. In order to reduce the amount of buy-sell signals, we synchronize our MACD with a RSI (Relative Strength Index). If the RSI is above 0.6, no buy signal is given, and if the RSI is below 0.6, no sell signal is given.
This indicator is quite effective in stochastic or oscillating markets.
|
| |
| Market |
|
|
theScreener.com provides analysis on stocks from 46 countries; we call those countries,
Markets.
| AU |
AUSTRALIA |
MX |
MEXICO |
| AS |
ASIA Ex JAPAN 1 |
NL |
NETHERLANDS |
| AT |
AUSTRIA |
NZ |
NEW ZEALAND |
| BE |
BELGIUM |
NO |
NORWAY |
| BR |
BRAZIL |
PA |
PACIFIC 4 |
| CA |
CANADA |
PH |
PHILIPPINES |
| DK |
DENMARK |
PL |
POLAND |
| EG |
EGYPT |
PT |
PORTUGAL |
| EP |
EUROPE 2 |
RU |
RUSSIA |
| EU |
EUROZONE 3 |
SA |
SAUDI ARABIA |
| FI |
FINLAND |
SG |
SINGAPORE |
| FR |
FRANCE |
ZA |
SOUTH AFRICA |
| DE |
GERMANY |
ES |
SPAIN |
| GR |
GREECE |
SE |
SWEDEN |
| HK |
HONG KONG |
CH |
SWITZERLAND |
| HU |
HUNGARY |
TW |
TAIWAN |
| IN |
INDIA |
TH |
THAILAND |
| ID |
INDONESIA |
TR |
TURKEY |
| IE |
IRELAND |
AE |
UNITED ARAB EMIRATES |
| IL |
ISRAEL |
GB |
UNITED KINGDOM |
| IT |
ITALY |
US |
USA |
| JP |
JAPAN |
WO |
WORLD |
| KR |
KOREA (SOUTH) |
WO |
Emerging Markets 5 |
| MY |
MALAYSIA |
|
1: CHINA, HONG KONG, INDIA, INDONESIA, KOREA (SOUTH), MALAYSIA, PHILIPPINES, SINGAPORE, TAIWAN, and THAILAND
2: AUSTRIA, BELGIUM, SWITZERLAND, CZECH REPUBLIC, GERMANY, DENMARK, SPAIN, FINLAND, FRANCE, UNITED KINGDOM, GREECE, HUNGARY, IRELAND, ITALY, NETHERLANDS, NORWAY, POLAND, PORTUGAL, RUSSIA, SWEDEN and TURKEY
3: AUSTRIA, BELGIUM, GERMANY, SPAIN, FINLAND, FRANCE, GREECE, IRELAND, ITALY, NETHERLANDS and PORTUGAL
4: AUSTRALIA, CHINA, HONG KONG, INDONESIA, JAPAN, KOREA (SOUTH), MALAYSIA, NEW ZEALAND, PHILIPPINES, SINGAPORE, TAIWAN, and THAILAND
5: BRAZIL, MEXICO, CZECH REPUBLIC, EGYPT, GREECE, HUNGARY, POLAND, RUSSIA, SOUTH AFRICA, TURKEY, UNITED ARAB EMIRATES, SAUDI ARABIA, CHINA, INDIA, INDONESIA, KOREA (SOUTH), MALAYSIA, PHILIPPINES, TAIWAN, and THAILAND
|
| |
| Market Capitalization in $bn |
|
|
This number is calculated by multiplying a firm's share price by the number of outstanding shares.
Note: The Market Capitalizations might not reflect price movements that occurred shortly before last update of theScreener's database.
|
| |
| Market Value |
|
|
|
| |
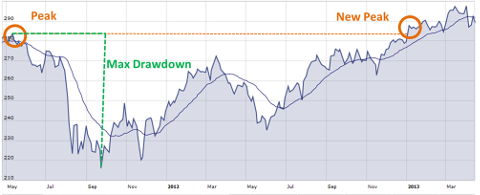
| Max Draw Down |
|
|
Max Drawdown is an indicator of downside risk over a specific time frame. Max Drawdown assesses the relative riskiness of a portfolio strategy by measuring the size of the largest loss. It calculates the maximum loss from a peak-to-valley, given the amount in percentage of loss incurred since the previous peak.
|
| |
| Medium Term Technical Trend |
|
|
---- STOCKS ----
The MT Tech Trend indicates the current 40-day dividend-adjusted tendency, positive [ ] or negative [ ] or negative [ ], and the column Tech Reverse indicates to which price this tendency is valid. ], and the column Tech Reverse indicates to which price this tendency is valid.
The MT Tech Trend is considered
neutral [ ]. Once the price breaks out of the +1.75% neutral zone, the MT Tech Trend
will change to positive or negative depending on the movement. ]. Once the price breaks out of the +1.75% neutral zone, the MT Tech Trend
will change to positive or negative depending on the movement.
The symbol [ ] indicates that the MT Tech Trend previous to the neutral situation
was positive. ] indicates that the MT Tech Trend previous to the neutral situation
was positive.
The symbol [ ] indicates that the MT Tech Trend previous to the neutral situation
was negative. ] indicates that the MT Tech Trend previous to the neutral situation
was negative.
The MT Tech Trend can be thought of this way: if it is positive it indicates that the market currently "likes" (or, is buying) the stock. If it is negative it indicates that the market currently "does not like" (or, is selling) the stock.
---- FUNDS ----
The column MT Tech Trend indicates the current tendency, positive [] or negative []
|
| |
| Moving down |
|
|
If, for example, at the current update a stock's MT Tech Trend is down [] but during the previous update period it was up [], it is considered to be "Moving down".
Example:
During the June 1st update period a stock's MT Tech Trend was positive. By the time of the June 4th update the stock's price dropped below its technical reverse point. This would trigger the MT Tech Trend to turn negative and the stock would be considered to have a MT Tech Trend "Moving down".
|
| |
| Moving up |
|
|
If, for example, at the current update a stock's MT Tech Trend is up [], but during the previous update period it was down [], it is considered to be "Moving up".
Example:
During the June 1st update period a stock's MT Tech Trend was negative. By the time of the June 4th update the stock's price was higher than its technical reverse point. This would trigger the MT Tech Trend to turn positive and the stock would be considered to have a MT Tech Trend "Moving up".
|
| |
| Nb of Positions |
|
|
This is an abbreviation for the number of holdings in a portfolio; the figure in () brackets is the number of investment vehicles not covered by theScreener.
|
| |
| Nb of Stocks |
|
|
This is an abbreviation for the number of stocks in an aggregate, index
or portfolio. By clicking on the underlined number you can access the list
of stocks that make up that aggregate, index or portfolio.
|
| |
| News Trend |
|
|
The News Trend shows the news sentiment for a company over the last 3 months (change of sentiment in brackets). The news sentiment S is calculated as S=(P+1)/(P+N+2), where P is the number of positive mentions, N is the number of negative mentions. For more detailed information, visit www.yukka.ai or contact Yukka via email: info@yukkalab.com
|
| |
| Oversold |
|
|
A title is deemed oversold from a technical perspective if the dividend-adjusted price falls below the bottom 15% of its volatility channel. (Example: If the lower and upper boundary of the volatility channel is 60 and 100 respectively, the title is deemed oversold if the price drops below 66 = 60+(100-60)*0.15)
|
| |
| Pass level |
|
|
The designated level that must be surpassed, whether in an upward or downward direction since the last update. For example, choosing all stocks that have a LT P/E lower than 10, moving down and passing by 11, will select all stocks that currently have a LT P/E lower than 10 and that in the previous update had a LT P/E greater than 11.
|
| |
| PEA |
|
|
A French PEA refers to a Plan d’Epargne en Actions, which is a tax-efficient investment wrapper for residents of France. It allows French investors to buy and sell European securities with preferential conditions.
PEAs were created in 1992 with the intention of encouraging French residents to invest in the stock market, which at the time was experiencing very low participation. Individuals are eligible if they live in France or an overseas French territory.
|
| |
| Peers |
|
|
---- STOCKS ----
A list of maximum 10 stocks, the most representative covered by theScreener, in the same Group, Sector or Country. The list appear first the stocks of the same country and then the remaining peers sorted by market capitalisation.
---- FUNDS ----
A list of maximum 9 funds, the most representative covered by theScreener, in the same Asset Class, Profile or Area. The list appear first the funds of the same area and then the remaining peers sorted by fund size.
|
| |
| PEGY Ratio |
|
|
The PEGY Ratio is an investment metric that extends the PEG (Price/Earnings-to-Growth) ratio by including dividend yield. It is calculated as P/E ratio ÷ (Earnings Growth + Dividend Yield). By factoring in both expected earnings growth and dividends, it gives investors a more complete picture of a stock's valuation, especially for companies that return significant cash to shareholders. A lower PEGY Ratio generally suggests a stock may be undervalued relative to its growth and income potential, while a higher ratio implies it may be overpriced. Typically, the next three years are considered but only if at least three analysts provided earnings estimates.
|
| |
| Pfolio Value |
|
|
This is found in the Portfolio Section. It is the total current value of a particular portfolio in a specified currency.
|
| |
| Price Ccy |
|
|
This is the price of a stock at the time of the latest update, and the currency that it is traded in.
|
| |
| Price-to-Book (P/B) |
|
|
The Price-to-Book (P/B) ratio compares a company's market value to its book value (net assets on the balance sheet). It is calculated as Market Price per Share ÷ Book Value per Share. A P/B ratio below 1 can suggest a stock is undervalued, potentially trading for less than the company's net assets, while a higher ratio may indicate that investors expect strong future returns, intangible asset value, or superior profitability not captured on the balance sheet.
That said, the P/B ratio should not be used in isolation. It is most useful for asset-heavy businesses like banks, insurers, or manufacturers, where book value closely reflects economic reality. For companies in tech, services, or other asset-light industries, book value may understate intangible drivers like brand, intellectual property, or human capital. In such cases, the P/B ratio can be misleading and should be supplemented with other valuation measures.
A negative Price-to-Book ratio indicates that the company's liabilities exceed its assets, so the metric is not meaningful and may signal financial distress.
|
| |
| Quality |
|
|
Based on the Screener PDF reports, the Quality represents an easy-to-use rating issued from the pdf report, where the quality appears as "Global Evaluation".
The Global Evaluation combines the upside rating (Stars) with a sensitivity. The Global Evaluation of shares is in addition influenced by the general condition of the market environment.
|
| |
| Quant |
|
|
This is an abbreviation for the word Quantity. It is used in the
Portfolio View of the Portfolio section, and refers to the quantity of shares
of a particular stock that was purchased and entered into a portfolio.
|
| |
| Rel Perf 2 weeks |
|
|
This is a stock's relative performance to its assigned benchmark compared to two weeks ago.
|
| |
| Rel Perf Buy Date |
|
|
This is a stock's relative performance to its assigned benchmark since its date of purchase.
|
| |
| Return on Equity (ROE) |
|
|
The return on equity (ROE) is the ratio between the profits made and own funds provided by the shareholders. The figure varies greatly from industry to industry.
|
| |
| Risk |
|
|
Risk is the combination of the VaR with the % hold in the portfolio.
The calculation represents the potential loss in value of an asset or portfolio over a defined period. For example, an investment of 25% in the portfolio with a VaR of 10% could impact the total assets by 2.5% over a medium term period (1 month).
The figure is calculated with a confidence of 95% meaning that there is only a 5% chance that the value of the asset will drop more than 10%.
|
| |
| RSI |
|
|
The RSI (Relative Strength Index) is an oscillator that measures the percentage of positive movements compared with the absolute value of all the movements. This oscillator is normally calculated on 14 or 21 days. Since, at theScreener we provide biweekly updates, we feel the 21 day method is best for this chart. This oscillator can vary between 1.0 and 0.0. If it is 1.0, it means that 100% of the movements during 21 days were positive. If it is 0.0, it means all of the movements during the 21 days were negative.
This indicator is quite effective in stochastic or oscillating markets.
|
| |
| Sensitivity |
|
|
The sensitivity is determined by combining the Bear Mkt Factor and the Bad News Factor. Each factor is assessed against its respective thresholds and classified into one of three categories: 'low,' 'medium,' or 'high.' The overall sensitivity is assigned the category of the higher-rated factor.
|
| |
| Sharpe 1 Yr |
|
|
The Sharpe ratio measures the performance of excess return (or risk premium) per unit of risk (volatility).This is done by taking the "asset return" less "the risk free rate of return" then dividing the result by volatility. The Sharpe number informs us of the assumed risk of an asset, indicating the payoff (excess return) per each unit of risk (volatility point).
The higher the ratio, the better the asset.
The formula: (asset return - risk free rate of return) / volatility
|
| |
| SRRI |
|
|
The synthetic risk and reward indicator (SRRI) is used to classify investment funds into one of three different risk categories (low risk, medium risk, high risk). It is calculated on the basis of Austrian and European regulatory requirements. This indicator forms an integral part of the Key Investor Information Document (KIID) and gives the historical volatility of the fund unit price on a scale from 1 to 7.
Investment funds with a low SRRI typically exhibit fewer price fluctuations and therefore a lower probability of temporary capital losses. Funds with a high SRRI experience greater fluctuations and also a greater risk of capital loss.
|
The fund category is not a reliable indication of future performance and may change in the course of time.
|
|
A category 1 rating should not be construed as indicating that the investment is free of any risk.
|
|
The risk indicator (SSRI) is indicated separately for each of the funds on our website, in the fact sheet and in the KIID.
|
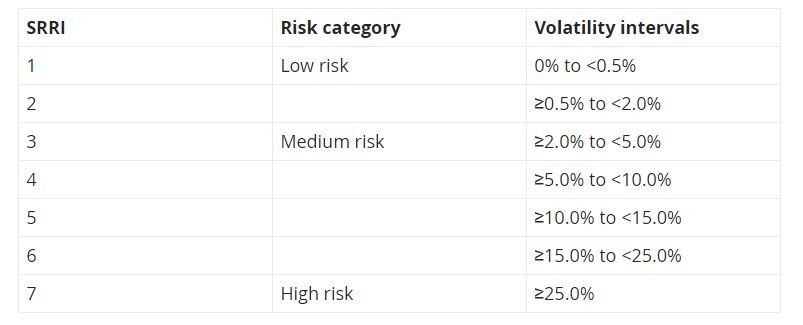
Methodology for the calculation of the SRRI
The volatility is calculated using the weekly past returns of the investment fund over the last five years. Where the investment fund’s returns history is too short, the performance of a representative portfolio model or other methodologies stipulated by legislators for SRRI calculation may be used. Any distribution of income should be taken into account. Volatility and SRRI as risk indicators do not differentiate the direction of fluctuations but only give the general inclination to fluctuate. A volatility of 3.0% means that the value of the relevant investment fund fluctuated on average by up to plus/minus 3.0% annually over the last five years.
|
| |
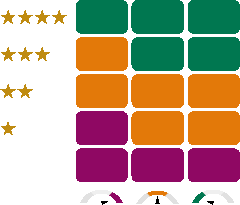
| Stars |
|
|
---- STOCKS ----
In this easy-to-use rating system, stars are earned for each element specified below:
Therefore, a stock can earn a maximum of four stars.
The lowest rating a stock can have is no stars.
Note
For each category, once a stock has earned its star it will keep it until:
---- FUNDS ----
In this easy-to-use rating system, stars are earned for each element specified below:
Therefore, a fund can earn a maximum of four stars.
The lowest rating a fund can have is no stars.
Note
For each category, once a fund has earned its star it will keep it until:
|
| |
| Stocks Of Interest |
|
|
Description of different types of Stocks Of Interest
Stocks with the best valuations
The Global Evaluation is a multi-criteria approach to identify the stocks with the best overall outlook. The assessment is the compilation of fundamental (PE, growth, earnings revisions, dividend, etc.),
technical (moving average, relative performance), and sensitivity (behaviour in declining markets and sensitivity to bad news) factors. In order to present a relevant selection, only companies with a market
capitalization above $1bn and showing good earnings growth valuations, are listed. Furthermore, the eligible stocks must have a minimum rating of two stars, a neutral to positive valuation, and a low to
moderate sensitivity. When the global rankings are identical, the analysts' 7 week earnings per share revision (7 wk EPS rev) acts as the deciding classification element.
The best defensive stocks
The sensitivity assessment is based on essentially two criteria: the stock's "behaviour in declining markets" (Bear Market Factor), and the stock's "sensitivity to bad news" (Bad News Factor). By positioning a
stock according to the world averages, three sensitivity levels can be attributed (low, moderate, high). Combining these elements makes it possible to create a final ranking of stocks in the market. To present
the most useful selection, only companies with a market capitalization greater than $1bn and showing good earnings growth valuations are listed. Furthermore, the eligible stocks must have a minimum
rating of two stars, a neutral to positive valuation, and a low to moderate sensitivity. In case of a tie, the stock's "behaviour in declining markets" will act as the deciding classification element.
The stocks with attractive dividends
Within this category, the equities that have been chosen are based on the expected dividend yield over the next 12 months. The selection takes into consideration only companies with payout dividends
totalling not more than 70% of their forecasted income. This is to ensure that only companies are included that show a strong potential for a continued payout of dividends in the future. This profile also
requires a minimum of 2 stars and a market value greater than one billion USD.
The stocks with the lowest PE
The price to earnings ratio (PE) may help to find undervalued stocks. If the PE of a stock is much lower than the PE of its reference market, the stock could have upside price potential. In order to present a
relevant selection, only companies with a market capitalization greater than $1bn and showing good earnings growth valuations are listed. Furthermore, the eligible stocks must have: a minimum rating of two
stars, a neutral to positive valuation, a low to moderate sensitivity. When the PE ratios are identical, the analysts' 7 week earnings per share revision (7wk EPS rev) acts as the deciding classification element.
|
| |
| the Screener's Trend Oscillator |
|
|
theScreener's Trend Oscillator can be defined as the ratio between the difference in the stock's price and the sum of the absolute values of all the movements during the course of one month.
This oscillator can vary between +1 and -1. As a general rule, breaking out of the +0.5 or -0.5 level signals a trend (positive or negative respectively).
This indicator is quite effective in trend driven markets.
|
| |
| theScreener's Portfolios |
|
|
STOCKS Portfolios Characteristics :
|
Maximum Stocks Invested
|
|
10 / 50
|
|
Cash authorized
|
|
Yes
|
|
Transaction fees
|
|
1%
|
|
Performance calculated with
|
|
2% total fees
|
|
Market Capitalization's Stocks
|
|
Depend on Portfolio Style and Market
|
|
|
|
|
|
Criteria IN
|
|
Global Evaluation: Positive or Slightly Positive
|
|
Criteria OUT
|
|
Global Evaluation: Negative, Slightly Negative
|
For more details please contact our Research & Development Team
FUNDS Portfolios Characteristics :
|
Maximum Funds / ETFs Invested
|
|
5 / 10
|
|
Cash authorized
|
|
Yes
|
|
Transaction fees
|
|
1%
|
|
Performance calculated with
|
|
2% total fees
|
|
Min Assets in $ mio
|
|
Depend on Portfolio Style and Market
|
|
|
|
|
|
Criteria IN
|
|
Global Evaluation : Positive or Slightly Positive
|
|
Criteria OUT
|
|
Global Evaluation: Negative, Slightly Negative or Neutral with a max of 1 Star.
Depend on Portfolio Style and Market
|
For more details please contact our Research & Development Team
|
| |
| Tactical Asset Allocation |
|
|
Tactical Asset Allocation is an active management portfolio strategy that shifts the percentage of assets held in various categories to take advantage of market pricing anomalies or strong market sectors.
For instance, if your Strategic Asset Allocation "Balanced" authorized 40% in Stocks with a minimum of 30% and a maximum of 50%, according to the Tactical Asset Allocation, the percentage of Stocks could be 30% if the number of Stars is 0 or 1. This percentage could be 50% if the number of stars is 3 or 4.
The Stars or Asset Class Ratings for each Asset Class reflect the interest in this category and are issued from the universe of Funds. The Stars are based on different criteria as Information Ratio, Sharpe, Technical Trend or Performance.
|
| |
| Target |
|
|
|
| |
| Tech Value |
|
|
|
| |
| Technical Reverse Point |
|
|
This is the price at which we project the momentum to reverse. When a stock's price crosses over its technical reversal point, it can be an early signal for a potential buy or sell.
|
| |
| Total Performance |
|
|
The Total Performance (Total Perf) of a stock is its current performance
(in percentage) compared to the price at which it was originally purchased.
|
| |
| Tracking-error |
|
|
The "tracking-error" shows the difference between an asset's actual return vs. its benchmark's return. The tracking-error is presented as a standard deviation during 52 weeks. In cases of less than 52 weeks, it is calculated on an annualized bi-weekly basis as soon as a minimum of 13 weeks are available.
The lower the tracking-error number, the closer the asset is performing to its benchmark. Monthly measures are more stable and reliable than bi-weekly measures.
Formula: standard deviation of (asset's monthly return - benchmark index's monthly return)
|
| |
| UCITS |
|
|
The Undertakings for the Collective Investment in Transferable Securities (UCITS) is a regulatory framework of the European Commission that creates a harmonized regime throughout Europe for the management and sale of mutual funds. UCITS funds can be registered in Europe and sold to investors worldwide using unified regulatory and investor protection requirements. UCITS fund providers who meet the standards are exempt from national regulation in individual European countries.
KEY TAKEAWAYS
|
UCITS stands for Undertakings for the Collective Investment in Transferable Securities.
|
|
This refers to a regulatory framework that allows for the sale of cross-Europe mutual funds.
|
|
UCITS funds are perceived as safe and well-regulated investments and are popular among many investors looking to invest across Europe.
|
|
| |
| Valuation Rating |
|
|
Our Valuation Rating indicates if a stock is selling at a relative premium or bargain price, based on its growth potential.
To estimate a stock's value relative to its current price our Valuation Rating combines:
|
stock price;
|
|
projected earnings;
|
|
projected earnings growth;
|
|
dividends.
|
By combining these elements we can establish a rating for the analyzed company.
There are five ratings, ranging from undervalued [ ] to overvalued [ ] to overvalued [ ] (see below). ] (see below).
theScreener.com Valuation Rating
(difference between projected value and current price)
When we analyze a company's projected earnings growth, we place a certain emphasis
on the PEGY Ratio. While the first two elements in our analysis are important, and
fairly simple to understand (stock price and earnings), the PEGY Ratio merits further
explanation.
Some analysts watch the PE (Price Earnings ratio) - the ratio of stock price divided
by earnings per share. In general, this ratio is fairly linear: a low PE suggests an
inexpensive/low-Sensitivity stock, while a high PE suggests an expensive/high-Sensitivity stock.
In our model, the concepts of expensive/inexpensive do not depend on the PE, but on
the relation between the PE and growth. Multifactor analysis has showed that the
estimated growth of earnings provides the best base for the evaluation of a stock.
There is approximately a 60% correlation of estimated earnings growth to stock value.
Our PEGY Ratio measure quickly evaluates a company and detects firms that offer
the greatest relative potential for the future and are therefore, the most undervalued.
Correspondingly, our PEGY Ratio also detects firms that offer the least relative
potential for the future and are thus, the most overvalued. Our PEGY Ratio measure
conveniently compares two stocks at a glance. Our growth projections are always based
on an average of at least three estimates.
The moment an investor buys a stock, the stock's present situation becomes the past,
and the success of the investment depends fully on the future. The Corporate focuses
on the future in order to establish a true Valuation Rating.
|
| |
| Value |
|
|
Used in the Portfolio View of the Portfolio section, this term refers to
the quantity of shares of a particular stock multiplied by the current market price.
|
| |
| Value at Risk (VaR) |
|
|
The Value at Risk, or VaR, is an indicator which measures the potential loss in value of an asset or portfolio over a defined period.
theScreener VaR is calculated to quantify the level of financial risk over a medium term period (1 month) with a 95% confidence level. If the VaR of an asset is 25% at one month, there is only a 5% chance that the value of the asset will drop more than 25% over any given month.
theScreener projected VaR model includes the historical VaR, the Stars Rating and the Risk assessment.
|
| |
| Volatility |
|
|
The volatility of a stock is its degree of random variability. A stock, which fluctuates
widely over time, has high volatility. One, which is stable, has low volatility. Both
short-term (1 month) and long-term (12 months) stock volatility figures are indicated.
Low Volatility
High Volatility
|
| |
| Volatility Channel |
|
|
The volatility bands are calculated using moving averages, adjusted up or down by the annualized volatility. The widest band represents fluctuations based on an average of 40 days, indicating possible movements in the medium term. The thinnest band is calculated on the same principle, but on a shorter frequency of 20 days.
When the stock's price breaks out of the bands it is a statistical anomaly and a return to the interior of the bands can be expected within the coming weeks.
When the interior band touches the exterior band, the stock's price very often rebounds in the opposite direction.
|
| |
| % |
|
|
Found at the top of its own column in the Portfolio View of the Portfolio
section, this symbol signifies the percentage of the total portfolio value made
up by the value of a particular stock.
|
| |
| % of Stocks in Uptrend |
|
|
This is the percentage of stocks in a given list that have a positive Medium Term Technical Trend. If, for example, the aggregate of Technology / World, which is made up of 458 stocks has 8% "of stocks in Uptrend", it means that 38 of the stocks within that aggregate have a positive Medium Term Technical Trend.
|
| |
| % to target |
|
|
If positive, signifies the amount by which the security's price should increase to reach its target. Conversely, if it's negative, it represents the amount by which the security's price should decrease to meet the target.
|
| |
| 4wk Rel. Perf. |
|
|
This figure measures the dividend-adjusted performance of a stock relative to its national index (compared to four weeks ago).
For example, a grade of 2 for a given stock would mean that this stock performed 2% better than its national index. On the contrary, a grade of -3 would indicate a performance of 3% under the index. We have chosen not to show the absolute performance, since the index remains the valid benchmark. For a given stock, figures that show an absolute gain of 2% in a market that also gained 2% do not represent any remarkable information. However, a stock that consistently beats its national index is clearly one sought after by investors. A chronic under-performance, of course, would indicate serious problems.
In fact, we use 4 week Relative Performance compared to Earnings Revision Trend. A positive Earnings Revision Trend for a stock that does not show a positive 4 week Relative Performance rating should force the investor to question the pertinence of this revision. In the other direction, a stock with a negative EarningsRev Trend that stills beats its index (4wk Rel. Perf. > 0) means that something special is happening with this stock, since investors are still buying it.
|
| |
| 6 months Relative Performance |
|
|
This is a fund's relative performance to its assigned benchmark compared to 6 months ago.
|
| |
| 7wk EPS Rev |
|
|
This is an abbreviation for 7 week Earnings Per Share Revision. This column concerns the value of these revised earnings. A figure of 2.8 implies that the analysts, compared with seven weeks ago, have now revised and raised their estimates by 2.8%. On the contrary, a negative number means that the earnings were revised at a lower estimate.
|
| |
